
Florence Nightingale: what her charts teach us about evidence
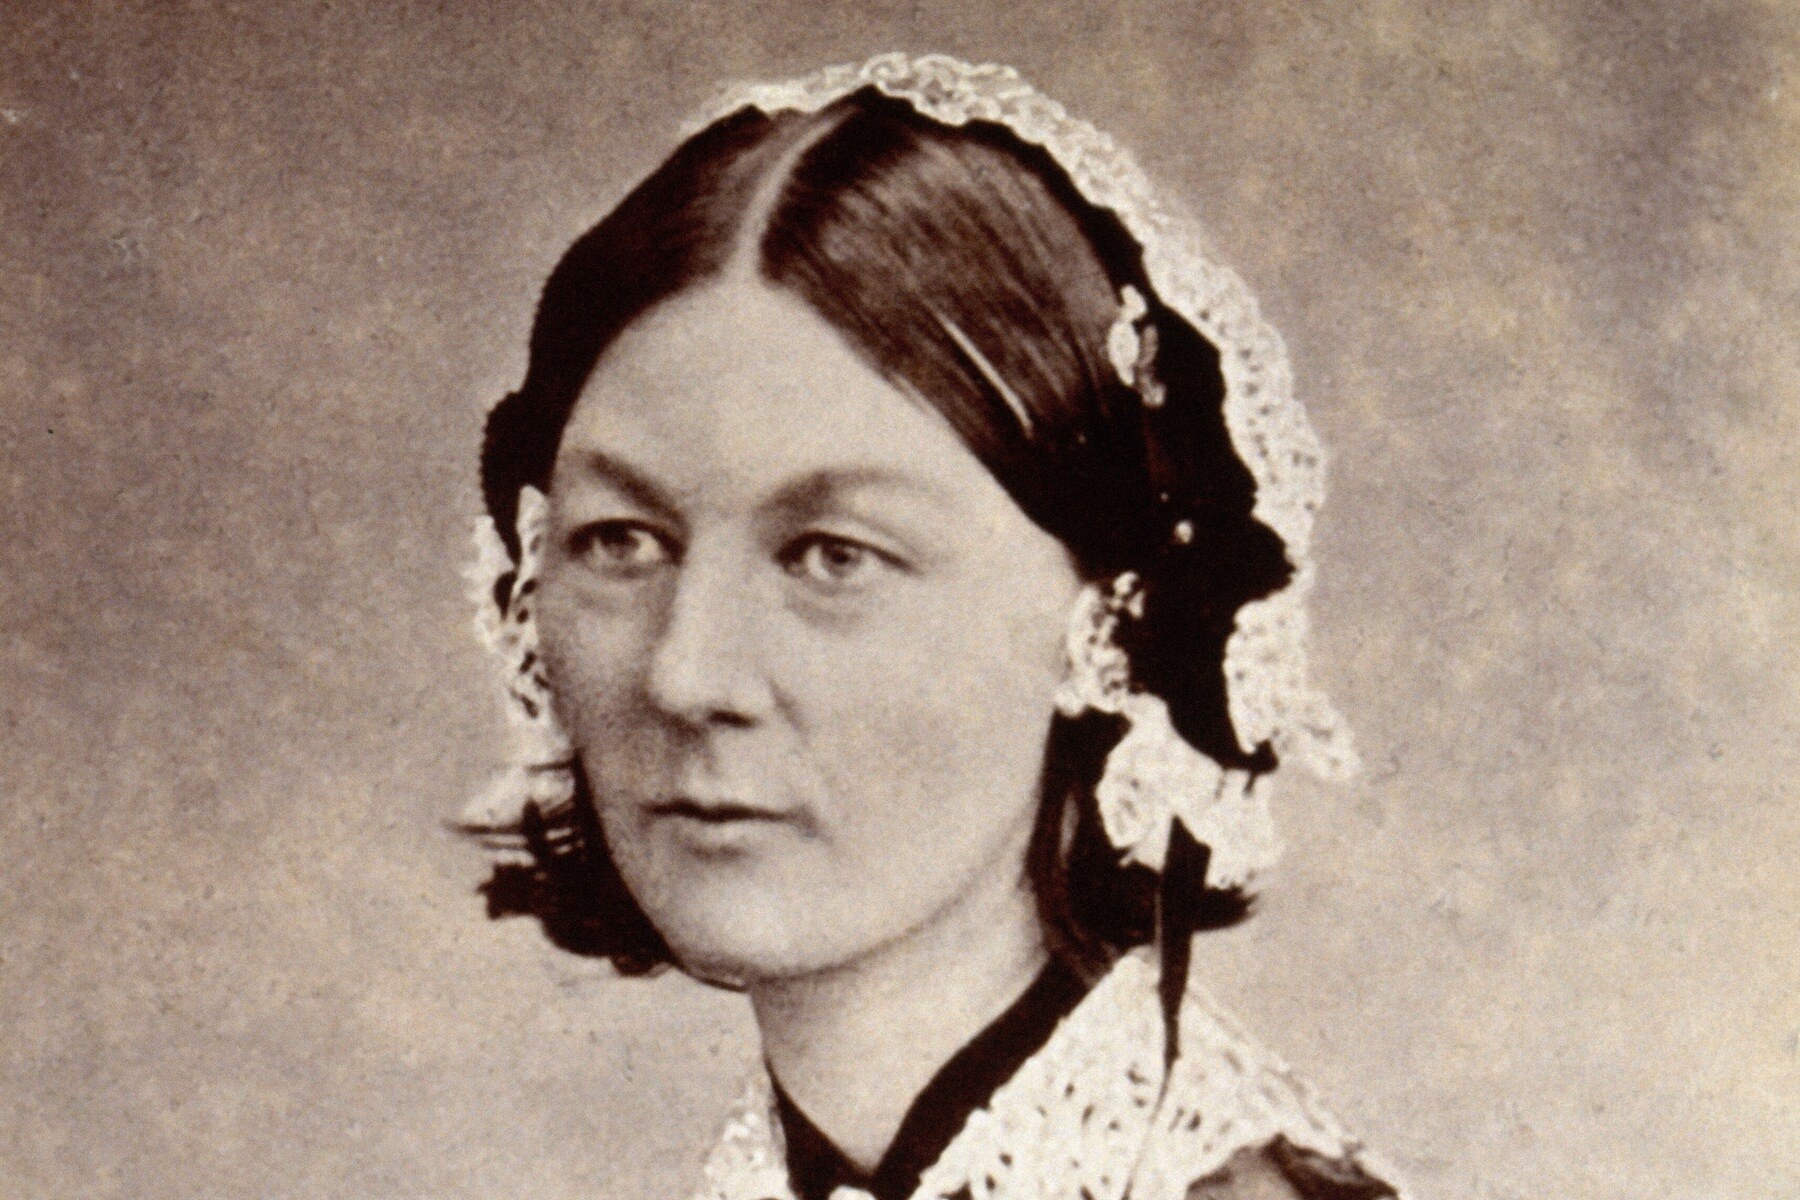
History explained: Florence Nightingale
Florence Nightingale’s best-known image is a nurse carrying a lamp. Another part of her work belongs on the page beside it: a statistician using evidence to make a public argument.
Her diagrams did more than decorate a report. They helped readers compare causes of death and see a pattern that a headline total could hide. That remains a useful distinction when a chart arrives in a newspaper, a government announcement or a social-media post.
Florence Nightingale and the argument in the chart
The Science Museum’s account describes her famous polar-area diagram of soldiers’ deaths during two successive years of the Crimean War. Each wedge represented a month. Its area showed the scale of deaths, with colours distinguishing preventable disease, battlefield wounds and other causes.
The blue areas made a disturbing comparison visible: preventable disease accounted for more deaths than wounds. A reader looking only at a single total would miss that division. A reader comparing the two years could also see how the pattern changed.
This was an argument about conditions, not a claim that a handsome graphic could fix a hospital. The museum describes Nightingale’s aim as reaching MPs, government officials and army officers who did not necessarily have statistical training.
Why a Florence Nightingale chart is not the whole explanation
It is tempting to compress that history into one heroic sentence: Nightingale arrived, changed nursing and made the death rate fall. The evidence deserves more care.
In a Gresham College lecture, Professor Lynn McDonald stresses the role of the Sanitary Commission, which arrived in March 1855, and the structural work on drainage, water and ventilation. Her account also places Nightingale’s statistical analysis after the war and connects it to official records.
That matters because a chart showing a change over time cannot, on its own, tell us who caused the change or separate every intervention. The history includes nursing, public administration, engineering and the conditions patients faced. Florence Nightingale’s contribution should not require making those other parts disappear.
Gresham College has published the full lecture: Florence Nightingale and her Crimean War Statistics, by Professor Lynn McDonald (video, Gresham College, 2014).
Florence Nightingale and the audience for evidence
The Mathematical Association of America’s account shows diagrams in the 1858 report on British Army mortality. It places them within the early use of statistical analysis in the health sciences, rather than treating them as isolated illustrations.
The Science Museum also describes Nightingale’s work with writer Harriet Martineau. Martineau’s 1859 book, England and Her Soldiers, carried the mortality diagram to a wider readership. Gathering and analysing evidence was one task; getting people to read and act on it was another.
Nightingale became the first female member of the Statistical Society in 1858, according to both the museum and the mathematical association. Her historical significance extends beyond the familiar bedside scene.
Questions to bring to any chart
The lesson from Florence Nightingale for a reader today is practical, not a demand to become a statistician. Ask what is being counted, which period is shown and what the colours or areas represent. Check whether the comparison uses the same basis throughout. Our explainer on why lower inflation does not necessarily mean lower prices shows the same habit applied to another headline figure.
Then separate description from explanation. A graphic can show that an outcome changed without proving a single cause. A striking number can be accurate while leaving important categories out.
Florence Nightingale used visual evidence to challenge an accepted story. The strongest tribute to that work is to read the evidence carefully, rather than accept the next striking chart simply because it looks convincing.