
Lower inflation: why it does not necessarily mean lower prices
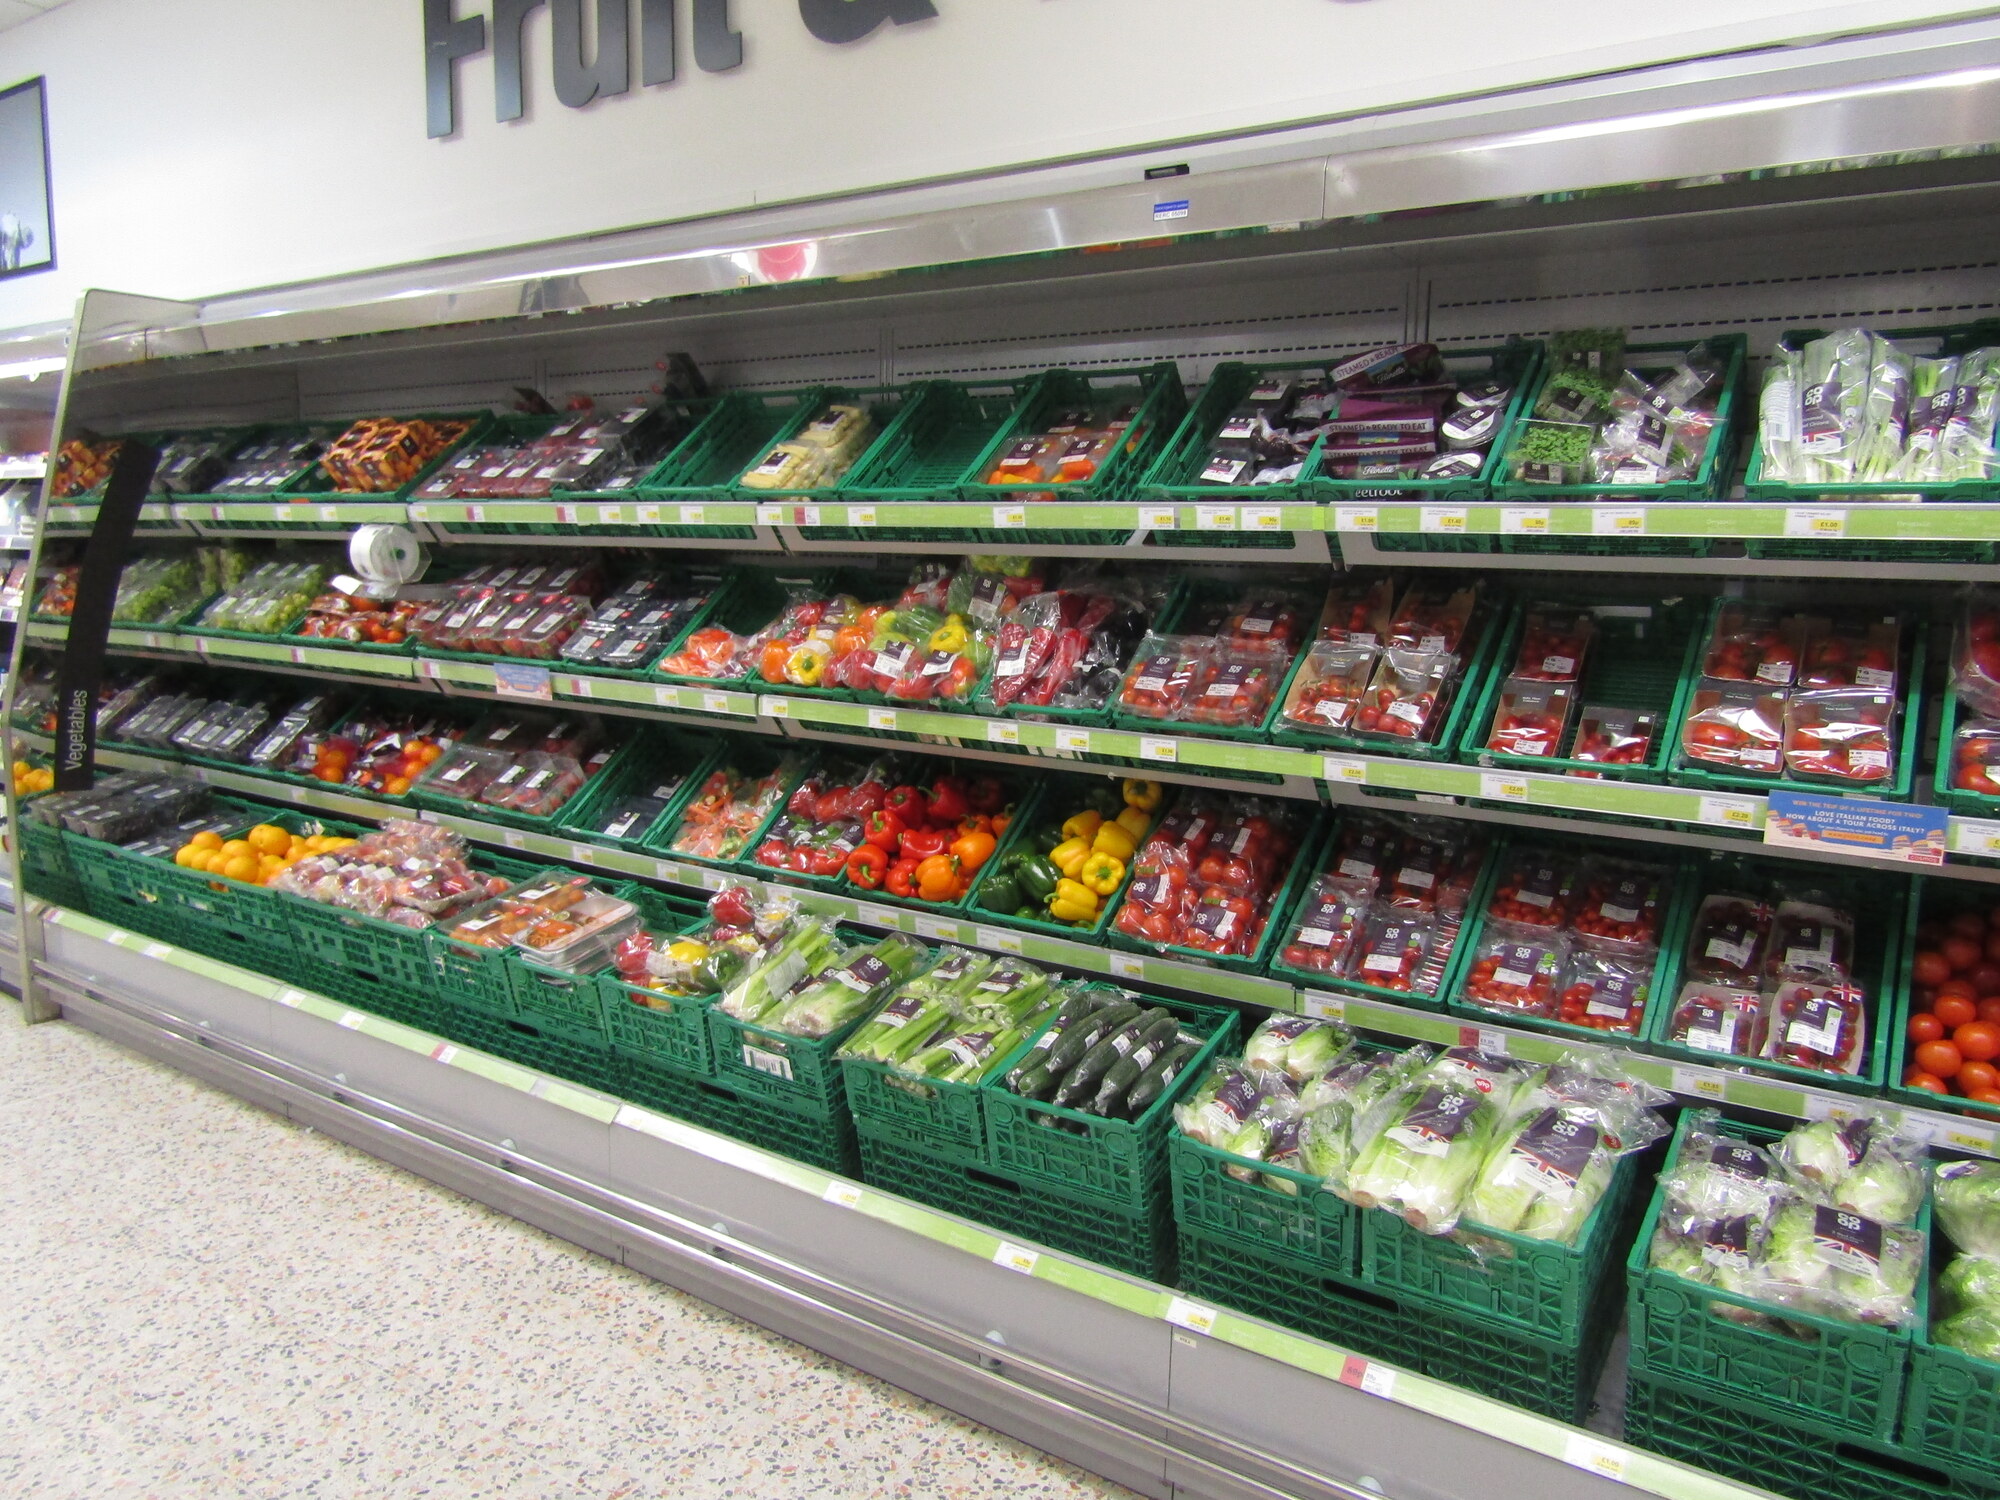

Lower inflation does not necessarily mean lower prices. The rate can decline because goods and services are becoming more expensive more slowly. That distinction helps explain why a better headline number may not feel like relief at the checkout.
Explainer | Sources checked 4 October 2026.
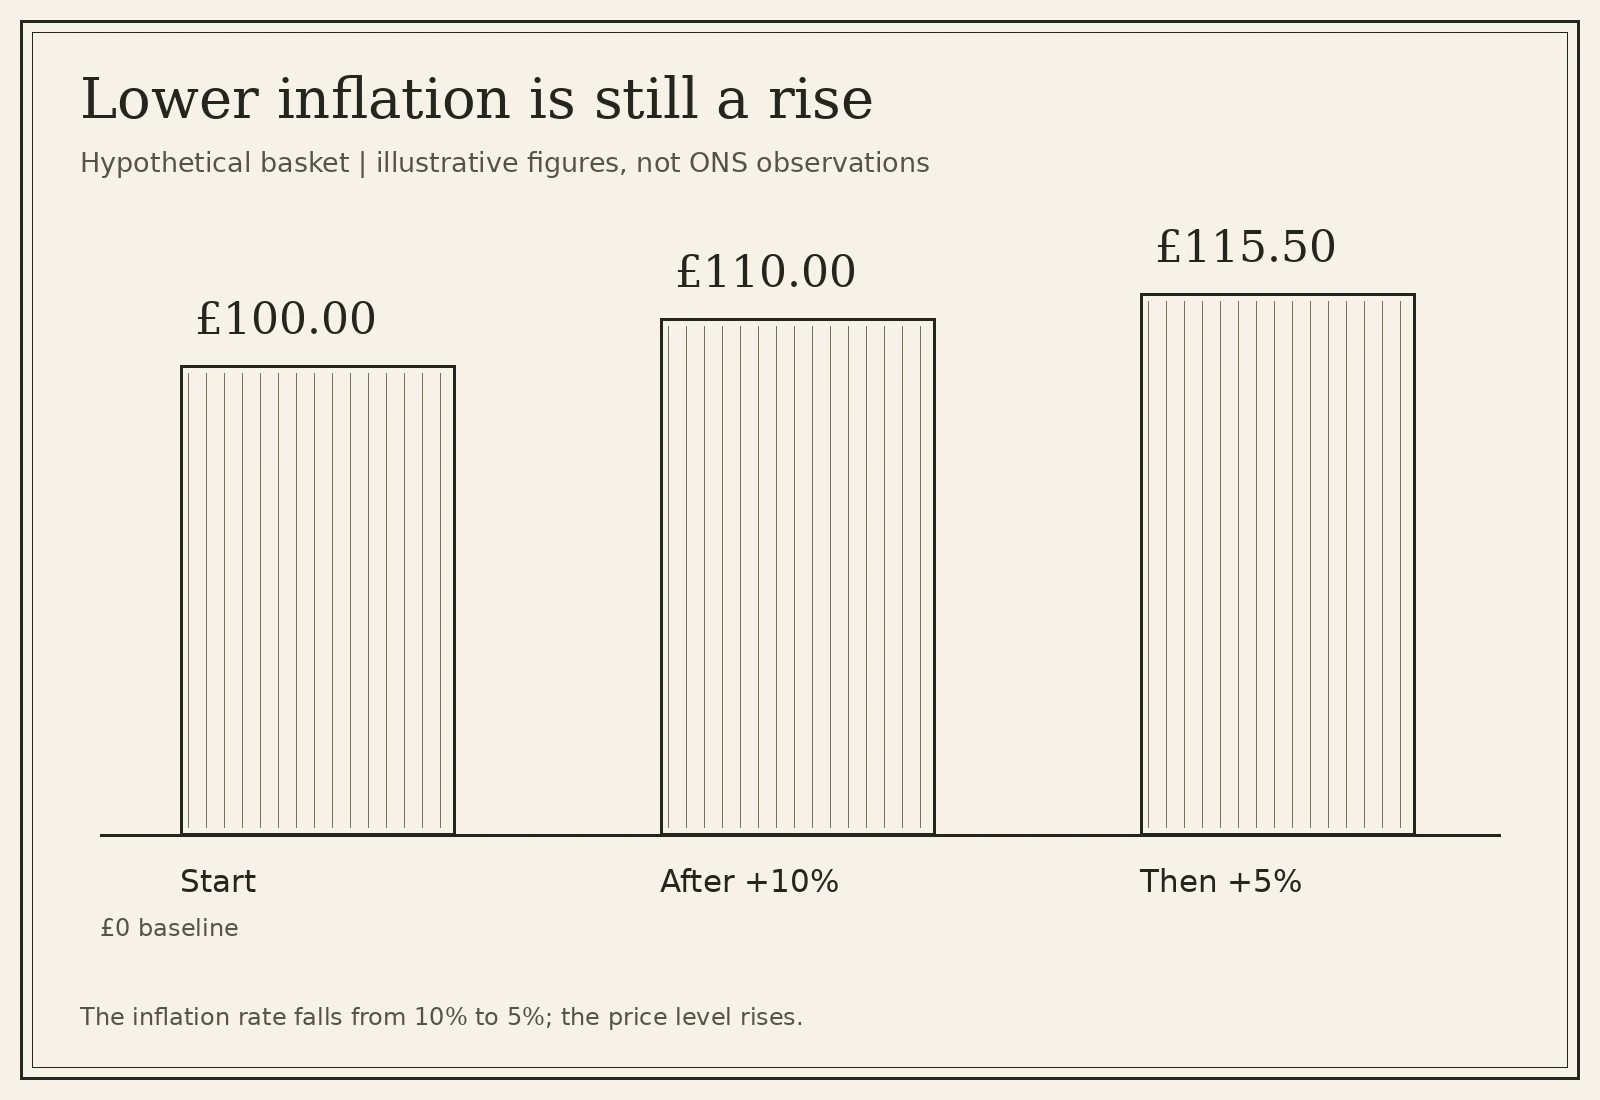
Text version of the diagram: Lower inflation example: a £100 basket rises 10% to £110, then 5% to £115.50, so prices still rise.
Lower inflation measures change, not the price tag
The Office for National Statistics publishes annual consumer-price inflation each month. It compares prices with those in the same month a year earlier. A lower positive rate still describes an increase over that comparison period, rather than a return to earlier prices.
A simple hypothetical example makes the difference clear. If a basket costing £100 rises to £110, the increase is 10 per cent. If it then rises to £115.50 over the following year, that second increase is 5 per cent. Inflation has slowed, but the basket costs more. These are illustrative numbers, not current UK inflation figures.
Martin Lewis made the same distinction in a 2009 MoneySavingExpert blog: low inflation means prices are rising more slowly, while deflation means prices are falling. That historical explanation supports the distinction here; the official definition and figures come from the ONS.
Your household is not the national basket
The headline measure brings together many goods and services. Different households spend different shares of their budgets on food, housing, transport and leisure. Price changes in the things you buy most can therefore affect you differently from the overall average. Lower inflation can feel different from one household to the next.
The ONS personal inflation calculator estimates a rate using household spending patterns. It can help show which categories are driving a household's cost increases, but it is an estimate, not a precise record of every bill.
Lower inflation: the limits of the comparison
The calculator cannot predict future prices or account for all changes in shopping habits and differences between products within a category. It uses CPIH, which includes owner-occupiers' housing costs and Council Tax, rather than being identical to the CPI headline often quoted elsewhere.
The useful question is therefore twofold: how quickly are prices changing overall, and what has changed in the costs your household actually faces? This explainer provides context, not personalised financial advice or a report of the latest inflation release.
Lower inflation and the household comparison
The comparison period is part of the statistic. An annual measure compares with the same month one year earlier; it is not a statement that every price changed during the latest month. A household looking at a bill should ask what dates are being compared and whether the goods or services are like for like. National averages and a particular purchase are different measurements.
The ONS uses a representative basket rather than pricing every transaction made by every household. It updates that basket to reflect changing spending patterns. Items that become less popular can leave, while new goods or services can enter. The purpose is to measure changing consumer prices overall, not to reproduce a single family's weekly shopping list.
Different measures answer different questions
CPI and CPIH are not interchangeable labels. CPIH adds owner-occupiers' housing costs and Council Tax to CPI. The ONS uses rental equivalence to measure owner-occupiers' housing costs: the rent a homeowner would pay for a comparable property. It is not a direct measure of changes in house prices or a reading of every homeowner's mortgage payment. Lower inflation on one measure may not match another.
The ONS household calculator uses mortgage spending as a proxy for owner-occupiers' housing spending when estimating a personal rate. That practical feature does not mean the national CPIH measure is calculated from mortgage repayments. Keeping the index methodology separate from the calculator's inputs helps avoid a misleading comparison.
Use an estimate for context, not a forecast
Lower inflation is one part of that picture, rather than a forecast of your next household bill. A calculator estimate shows what lower inflation has meant so far, not what comes next.
The calculator asks about spending across categories, and its guidance encourages users to include irregular purchases such as appliances or cars. Where a household leaves some categories unspecified, the tool can use indicative average spending. More detailed inputs improve the usefulness of the comparison but do not remove the limits of an estimate.
A personal inflation estimate can explain why two households experience the same year differently. It cannot predict the next energy bill, choose a financial product or establish that a particular shop has charged an unfair price. The underlying bills, contracts and prices still need to be checked for those decisions.
Sources
- ONS: what inflation means and how it is calculated
- ONS: household inflation calculator and limitations
- ONS: consumer price inflation methodology
Related explainers
- How a bill becomes law: from parliamentary proposal to implementation
- Local library services: beyond the bookshelf and into digital borrowing